Home | Altura Blog |
Infographics
September 11, 2021 | Altura Blog
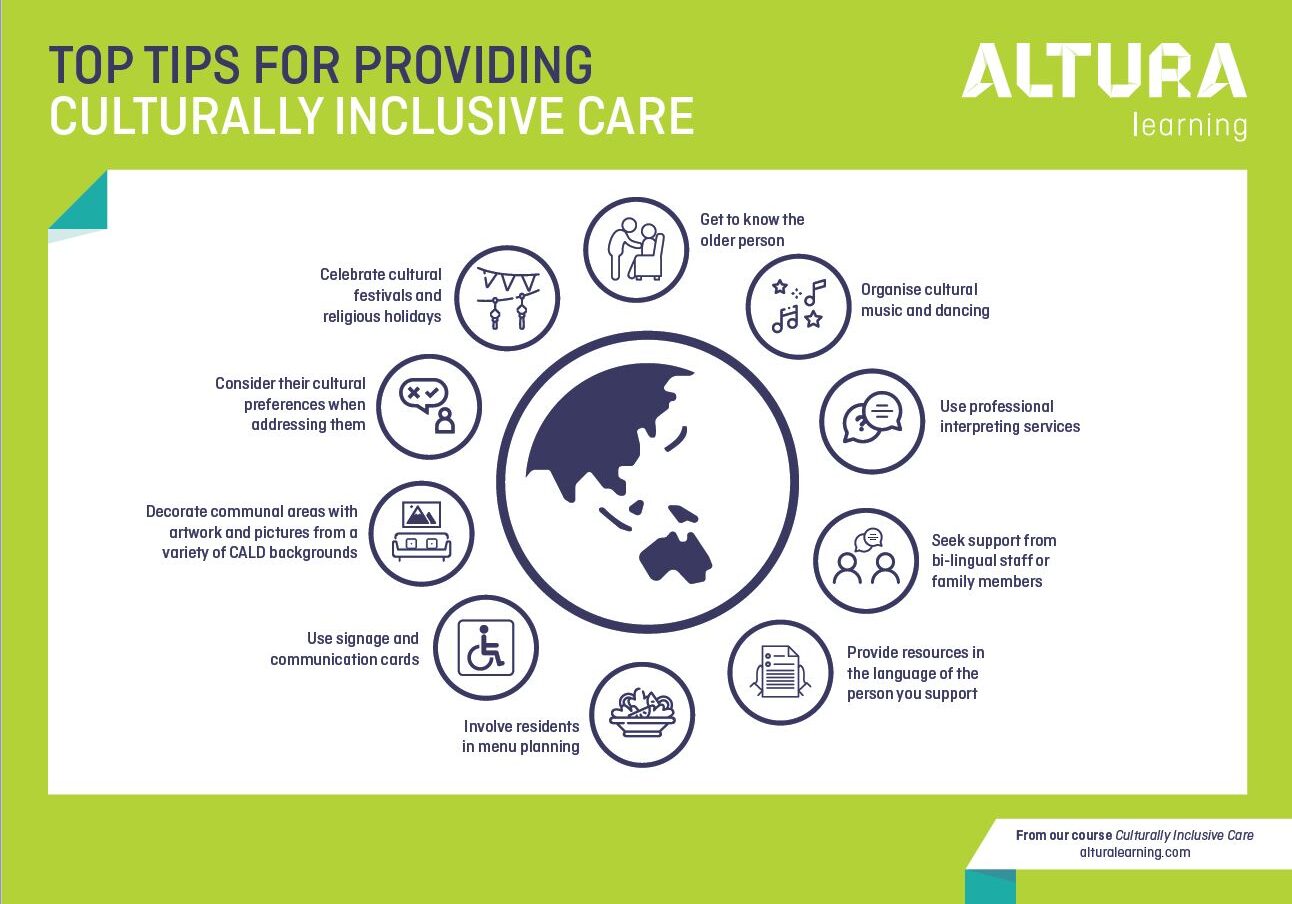
It’s hard to believe that Infographics have been in development since as early as 37000BC. The very first markings found in caves created by the early man to inform and teach fellow humans, began the notion that a picture speaks a thousand words. And this idea has since developed into the modern era of teaching to provide learners with visual tools that can communicate multitudes of information and data.
Research suggests that learners find it easier to retain and comprehend complex information and data when presented with visualisation, and this is why we at Altura Learning use infographics to complement the content of our courses.
But have you ever explored the versatility of the tool?
Infographics can be used:
- As a time saving tool and to increase engagement. It’s a fact that visual presentation with graphics is more engaging for most people, and with the ability to put more information into a smaller area, allows for faster digestion of a subject. Infographics can also be used to stir up interest amongst learners about a topic they may be training on soon or utilised in induction packages for new members of staff.
- As a problem solving tool. It can be difficult for staff members who may be new to the industry to remember the correct handwashing techniques or the order of multiple steps. The placement of a handwashing infographic by the sink can help to eliminate the problem and reduce infection control risks related to poor hand hygiene.
- As a revision tool. Infographics are a simple tool for presenting complex or large quantities of information that the learner needs to know. Infographics can be used to simplify information and assist learners to recall information.
- As a tool for others. Infographics can be displayed in your organisation for visitors or users of your service to view and inform them about something that may impact them. For example – COVID-19 Infection Control Procedures.
- As a microlearning tool. Learning today needs to be instantly available, effective and succinct. Infographics can achieve this by providing immediate access to condensed information that equips learners with the knowledge they need. An example of this could be using an infographic at a handover meeting or following a safeguarding incident at work to re-educate or recap staff on signs and symptoms of abuse.
- To bridge gaps in learning. A gap in a staff member’s knowledge may be identified during an appraisal where a full training session is not required. It can be helpful to refer the individual to the related infographic to explore the subject and increase knowledge in the subject area.
- To educate everyone. The simplicity of our infographics means they can be shared with different departments or branches of your organisation digitally, allowing further utilisation and learner reach.
- Retention of information. After formal education has been conducted, infographics can be circulated to used to reinforce key points to aid in the retention of information.
There are many other ways in which infographics can be utilised during training and the everyday running of a care organisation. Offering stimulating and creative ways to ensure your staff have the right knowledge at the right time and contributing to better outcomes for the individuals using your services.
We’d love to hear how you’re using our infographics. Please email us at learning@alturalearning.com and share with us your great tips. We’d love to feature them in our next newsletter!


